Industrial Stability Intelligence
They see failure. We see it coming.
Before scrap. Before downtime. Before expensive failures. You already have the data - what you don't have is visibility into the stability boundary.
Why plants call us
The output is wrong. The usual signals look normal.
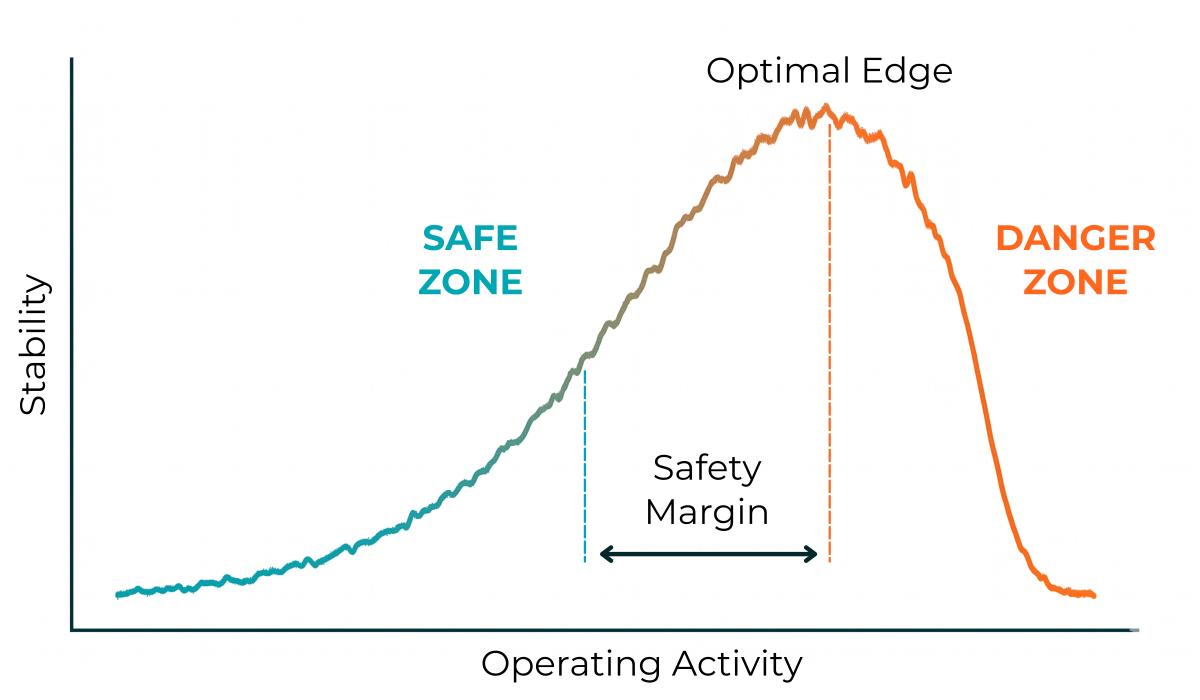
Hidden instability appears first as small variations, uncertain decisions, and invisible process drift. By the time conventional indicators react, valuable operating margin has already been lost.
Machine looks healthy but output isn't
SPC shows normal, but problems continue
Tool life changes from batch to batch
Production cannot be increased safely
Root cause remains unknown
Why conventional methods fall short
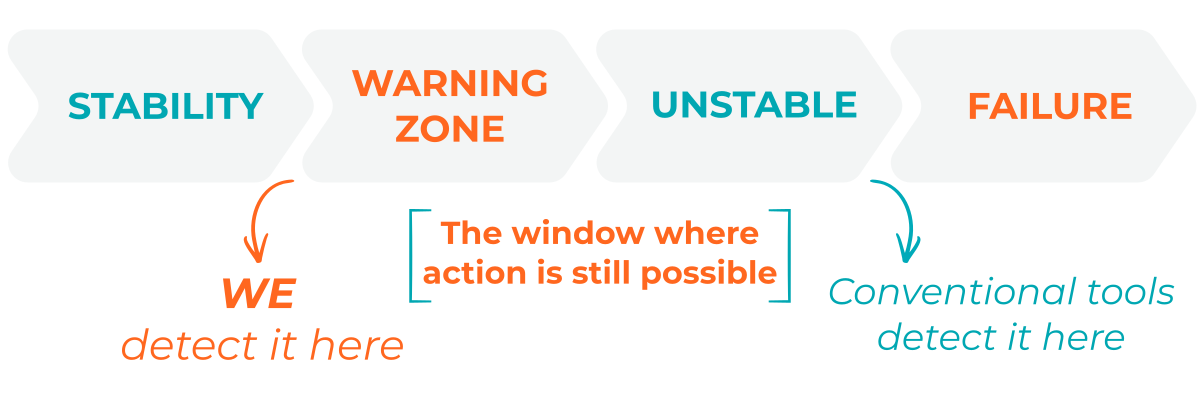
Current tools do not detect instability. They detect its consequences.
All three approaches - SPC, AI / Data analytics, and Control systems & Automation operate the same way. They respond after a problem becomes measurable. The window where intervention is still reversible - is never seen.
Statistical Process Control (SPC)
What it does: Tracks variation after it appears in measurement. Flags deviations from a historical average.
Physics reality: Process instability begins before any statistical measure changes.
AI / Data Analytics
What it does: Learns patterns from historical production data. A process that fails in a new mode is invisible to trained models.
Physics reality: Instability is a change in process behaviour - not a pattern in historical data.
Control Systems & Automation
What it does: Holds process parameters at set values. Reacts when a measurement drifts.
Physics reality: A control system keeps you at a setpoint. It cannot tell you how close that setpoint is to failure.
Flagship service
Process Stability Audit
We convert existing industrial process data into decision-ready industrial intelligence - revealing stability boundaries, operating margins, and early warning signals without additional hardware.
Explore the audit →- 01Your Data
- 02Behavior Mapping
- 03Early Warning Detection
- 04Limit Identification
- 05Your Answers
Decision-ready evidence
What you receive
Clear industrial intelligence, structured for action.
Stability Limit
where stable operation ends
Safety Margin (%)
how far current operation sits from the limit
ETSN
Energy Transformation Stability Number — a 0–10 scale score for overall process stability
Operating Activity
your process's current operating state
Early Warning
the first signs of drift, before any sensor or alarm registers it
Recommended Operating Window
the range you can safely run within
Recommended Parameter Changes
what to change, and by how much
Where it applies
Industries we Support

Machining
Tool life varies, high scrap rate

Steel
Quality varies daily, yield keeps dropping

Bearings
Unexpected failures, failure unexplained

Welding
Weld quality varies, distortion increases

Semiconductor
Yield suddenly drops, root cause unknown

Wind energy
SCADA looks normal, power curve drifting
Research validation
Research Before Claims. Physics Before Assumptions.
Our methodology is informed by physics, validated against real process behaviour, and designed to make scientific insight usable in industry.
Read our research philosophy →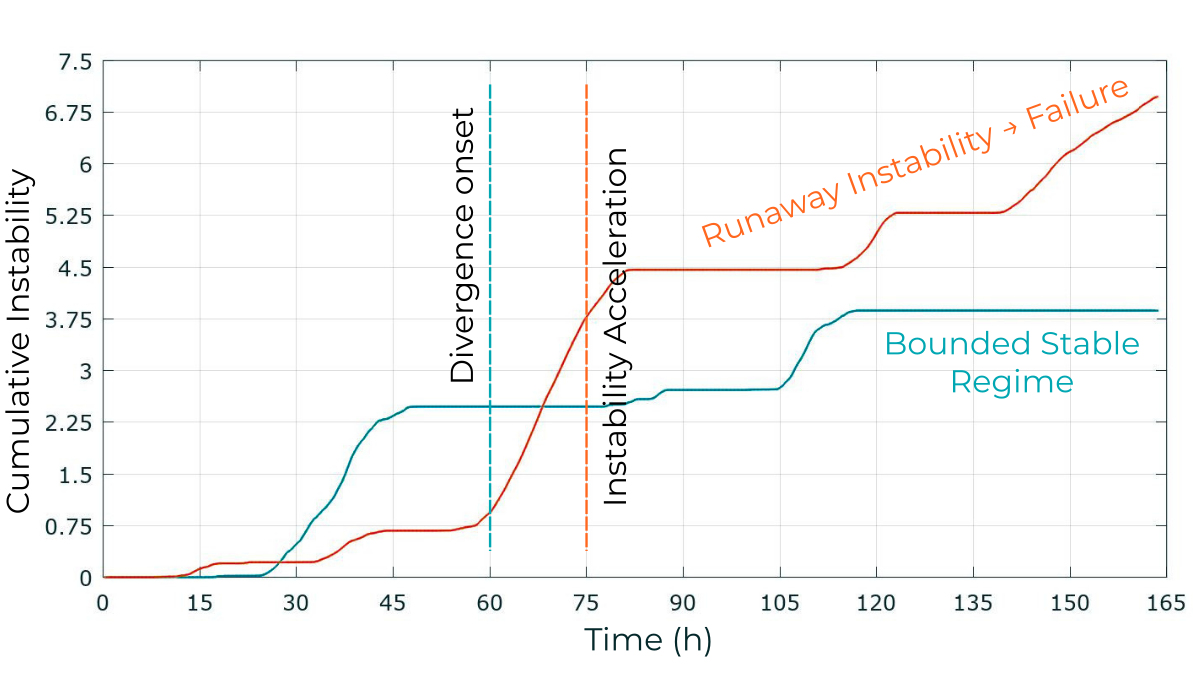
Why DOLIREX
Why Industries Trust DOLIREX
PhD-led techno consultancy
Physics-first methodology
Uses your existing process data
No additional hardware required
Applicable across multiple industries
Decision-focused technical reports
Latest insights
Ways into the Framework
Start wherever is useful — the problems we solve, the evidence behind the method, or the physics underneath it.
Industries
See the industry-wise specific problems this framework addresses - from machining to wind energy.
Explore Industries →Research
Review how the methodology performs against real industrial benchmark datasets.
View Validations →Knowledge Hub
Deep explanations of the physics and stability concepts behind the audit.
More Insights →Frequently asked questions
Questions before you start
Clear answers about Industrial Stability Intelligence, data requirements, and the Process Stability Audit.
What is Industrial Stability Intelligence?
Industrial Stability Intelligence is DOLIREX's approach to identifying how close an industrial process is to instability. It uses physics-first analysis of your existing process data to reveal the stability boundary, the safety margin around it, and early signs of drift - before scrap, downtime, or failure appear.
What is a Process Stability Audit?
One audit, one dataset, three answers: where your stability boundary is, how far you currently are from it, and what to change — and by how much.
Do we need additional sensors or hardware?
No. The audit works on your existing process data. No system changes and no additional hardware are required.
What process data do you need from us?
Whatever your process already produces — signals, video, or parameters. No new data collection is required before the audit begins.
How is this different from Statistical Process Control (SPC)?
SPC tracks variation after it appears in measurement. The Process Stability Audit detects instability before variation starts — instability begins before any statistical measure changes.
How is this different from AI or machine-learning monitoring?
AI/ML learns patterns from historical production data, so a process that fails in a new mode can be invisible to a trained model. Instability is a change in process behaviour, not a historical pattern.
How is this different from a control system?
A control system holds process parameters at a setpoint and reacts once a measurement drifts. It cannot tell you how close that setpoint is to failure.
What is ETSN?
Energy Transformation Stability Number — a 0–10 scale score representing overall process stability.
What will we receive from a Process Stability Audit?
Seven outputs: Stability Limit, Safety Margin (%), ETSN, Operating Activity, Early Warning, Recommended Operating Window, and Recommended Parameter Changes.
Which industries can use this approach?
Seventeen industries, including machining, steel, automotive, welding, bearings, semiconductor, wind energy, pharma, and food — with validation on real datasets from several of them.
DOLIREX Resources
Read the essentials
A concise introduction to DOLIREX, our approach, and our engineering capabilities.
Start with evidence
Start with one dataset
We will begin with the physics question behind your process.
Book a Consultation